PRODUCT INFORMATION

1
2
3
4
5
1

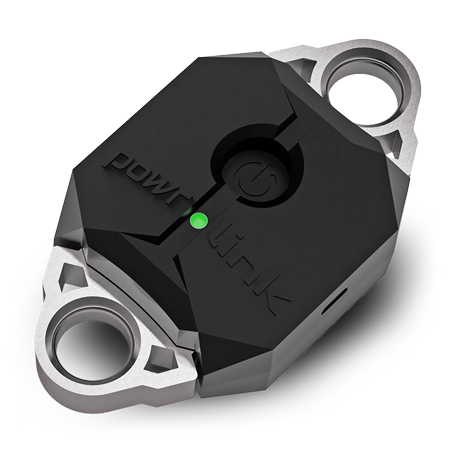
Power button – switch the device on and off

2

LED – slow flash = standby. Fast flash = connected. Red = charging and resetting.

3

Recharging / reset – micro-USB charging and product reset.

4

Connection 2 – connect your fitness device here

5

Connection 1 – connect to the holding structure here

powrlink sensor: this product is designed to read resistance data by installing it between the resistance source and a load bearing part. To install powrlink sensor you use the eyelets on either end of the product to intercept the generated resistance. In order to connect to your fitness device, it needs to have a carabiner for connecting the resistance source to the load bearing part.

  1. Hook up the existing fitness device with its carabiner into eyelet 1 of the powrlink sensor.
  2. Hook up a second carabiner into eyelet 2 or the powrlink sensor. This carabiner needs to be able to take the same load as the fitness device carabiner.
  3. Connect the second carabiner to the load bearing part of the fitness device.

To switch on the powrlink sensor briefly touch the power button that is recessed on the top of device. A green led will indicate that the unit has been switched on.

To switch off the powrlink sensor, hold the power button for 5 seconds until the green led flashes long.

TERM DEFINITIONS & REQUIREMENTS

  • Session

    A workout session consists of one or many exercises

  • Exercise

    An exercise consists of one or many sets

  • Set

    A set consists of one or many reps (repetions)

  • Rep

    A rep is one occurrence of one full movement

powrlink sensors can only be operated with an accompanying smartphone application. The app requires you to have online access. The powrlink app is currently available for Android and iOS devices. Data is sent wirelessly from the sensor to your device and we require at least iOS 9 or Android 4 with BLE support.

Before use of the app please carefully read our terms and conditions as well as the privacy policy. After you registered you will receive an email that lets you verify your registration. The email is sent from app.powr.link. After verification you will be able to log into the application.

THE APP CONSISTS OF THESE BASIC SECTIONS

1
2
3
4
5
1

My training – the training log of your sessions and exercises

2

Session view – for tracking whole workouts

3

Live view – instant tracking and recording

4

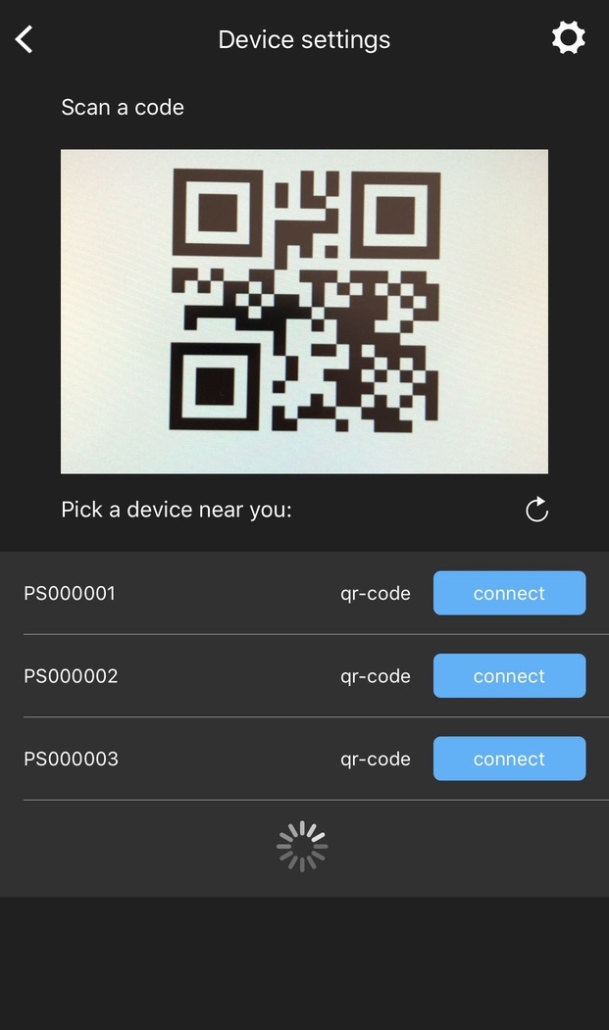
Device settings – here you can connect to a powrlink by scanning a barcode or choosing it from a list

5

My account – here you can edit your profile as well as get help and contact us

  • Live view – instant tracking and recording
  • Session view – for tracking whole workouts
  • My training – the log of your sessions and exercises
  • Device settings – here you can connect to a powrlink by scanning a barcode or choosing it from a list
  • My account – here you can edit your profile as well as get help and contact us

We display training data in so called powr-circles. powr-circles enable you to make sense of your training data by showing visual percentages in form of a clockwise increasing, colored outer circle. These circles will show you:

  • Live measurement data
  • Your personal best for the current scope (set, exercise, session or all time)
  • Percentage of your live data versus your personal best displayed as filling up circle

THE LIVE VIEW

1
2
3
4
1

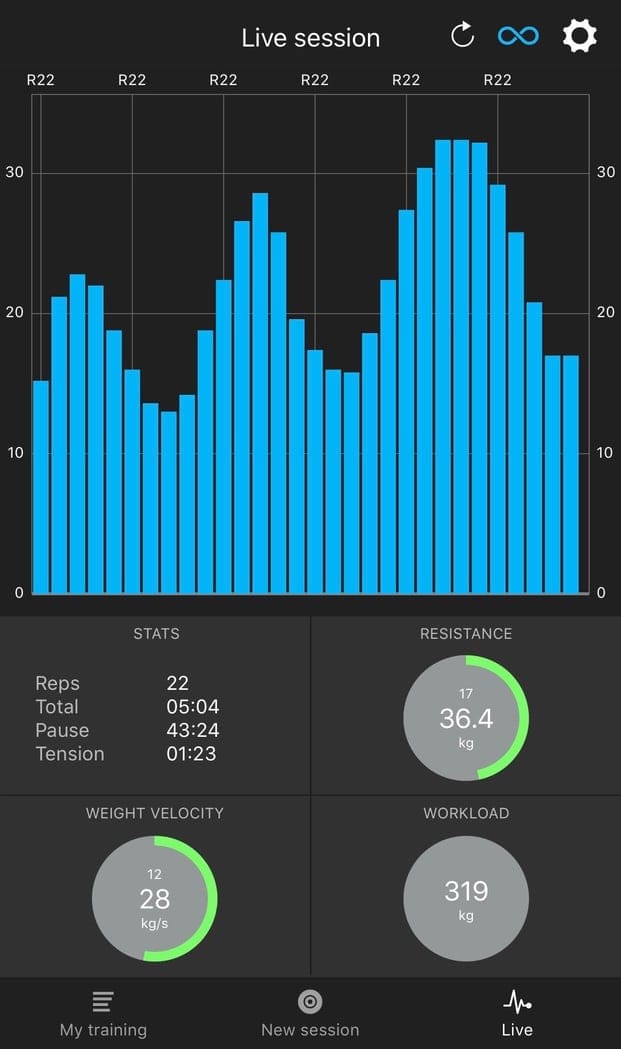
The graph will help you to understand your current training set visually.

2

Essential data about your training. See repetitions, the time under tension and overall workload.

3

powr-circles visualize how far away you are from your best effort in this scope. 

Green: <75% Yellow:  75%-100% Red: >100%

4

Reset at any time. Saving a live session will make it available in your training log.

Get right into it without any prior setup. Live view just works and will give you detailed resistance data from your current training setup. Please note that upon connection to a sensor it will be calibrated to factor in equipment weight. Of your resistance readings are off, it might be that the powrlink was under load when you connected to it. In this case, please go to device settings and click on calibrate for the currently connected sensor.

The live view consists of a graph in the upper part and a data section in the lower part of the screen. The graph will help you to understand your current training set as it will plot out a visual representation of your current set. It will enable you to see how smooth or erratic the resistance is applied.

The lower part will give you essential data about your training. The app will try to determine the repetitions, the time under tension, the overall workload and the how fast the resistance is generated. Additionally, the powr-circles will visualize how far away you are from your best effort in this set.

You are able to reset the live session at any time. To do that simply tap the ↺ symbol. You will be asked if you want to save the live session or not. Saving a live session will make it available in your training log (please refer to the training and exercise logsection).

THE SESSION VIEW

1
2
3
4
5
1

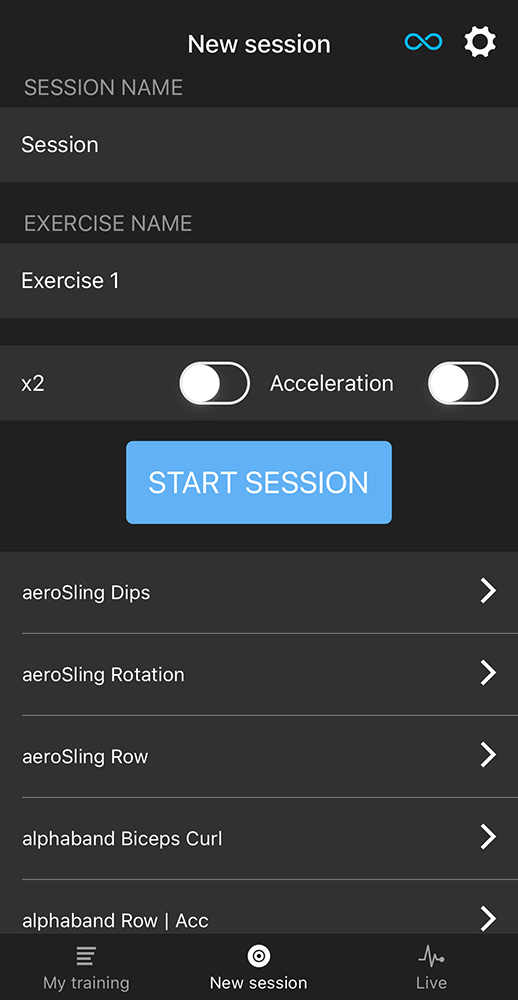
Name this workout session so that it makes sense for you later on in your training log

2

Enter once. If you do the same exercise again, select it from the list below (4).

3

When you do bilateral exercises and record only one side (think cable tower)

4

List of previous exercises. Select, if you do the same exercise again and want to compare performance.

5

Measure real acceleration during this exercise. Displayed in the lower left gauge. Note: Obviously the powrlink Sensor needs to be where the action is.

New session is where you record a whole workout session and segment it into exercises. This enables the app to determine how you are doing in a single exercise over time. You also have more point of references to compare to during the workout-session as well is in the training history.

In order to help you compare your efforts we have added more powr-circles then in the live view. These are grouped in tabs in the lower section of the screen. They not only show you how you are doing in the current set but also how you are doing compared to previous sets of this exercise in this session and even compared to all occurrences of this exercise across all sessions (your all time max for this exercise).

MY TRAINING – TRAINING AND EXERCISE LOG

1
2
3
4
1

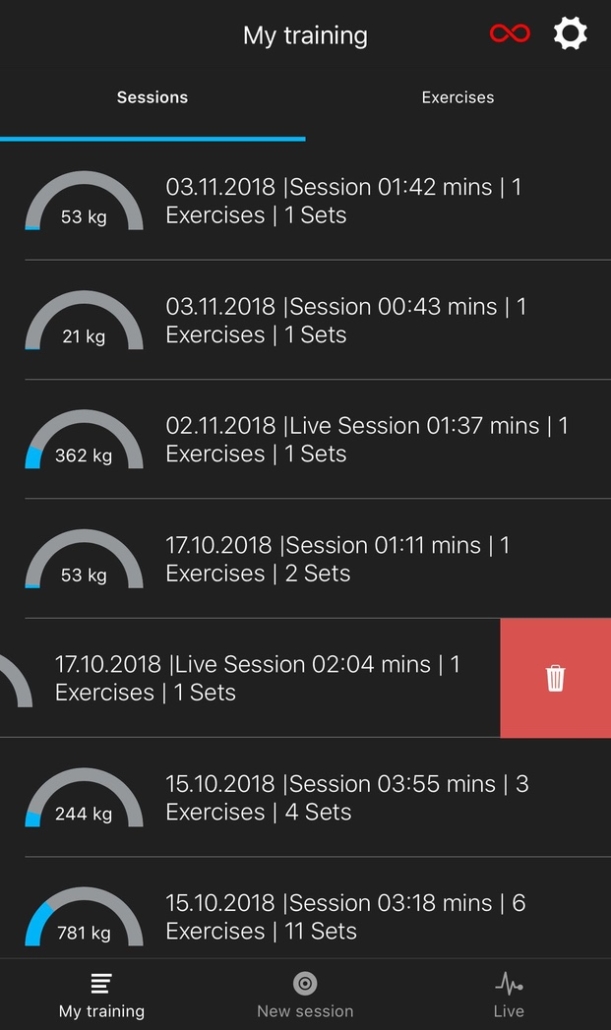
Choose between the session and the exercise list view

2

Total workload

3

Session info. Tap to analyze session in detail.

4

Swipe left to delete session

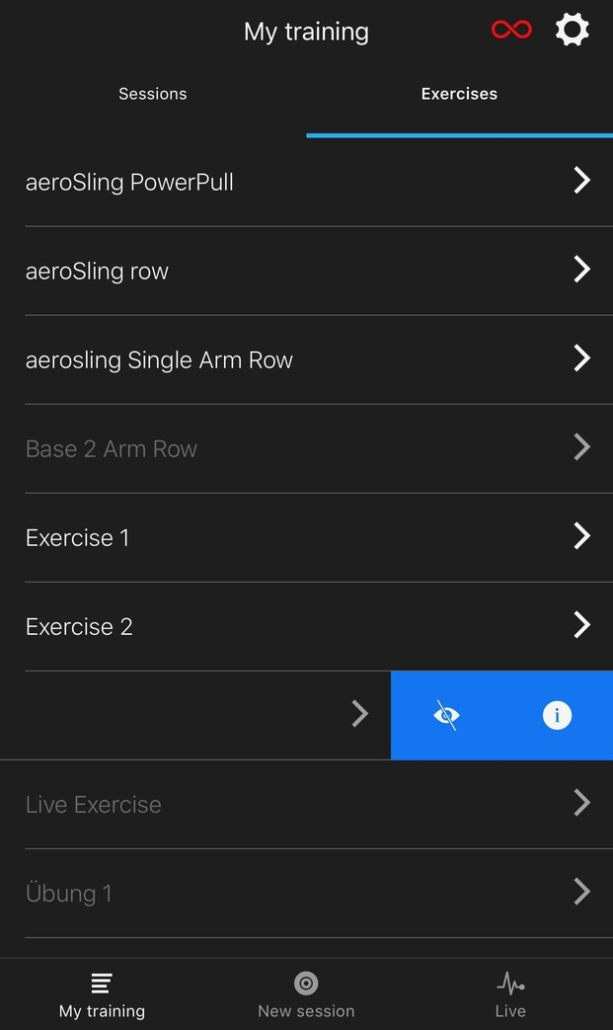
My training is your personal training log. Here you can find previous sessions and also saved live session. Additionally, you´ll find all of your exercises that you entered in a workout session. We backup your training data to our cloud server so you will be able to access your log even if you change your smartphone.

The sessions list will display your recent workouts along with some key information about those workouts like total workload, length and number of exercises and sets within those workouts. A swipe from right to left will let you delete a whole workout session. A tap on the respective session will get you to the workout analytics screen.

The Exercise list will display all exercises you have entered in the session view. A swipe from right to left will let you rename or hide each exercise. Hiding exercises is useful to unclutter the exercise list in the session view and to make it easier for you to find relevant exercises. At the moment you cannot delete exercises because of data integrity reasons. The is one special exercise called live exercise. This is where we store your live sessions that you chose to save. This exercise is always hidden because it makes no sense to select it in the session view.

SESSION ANALYTICS

1
2
3
4
1

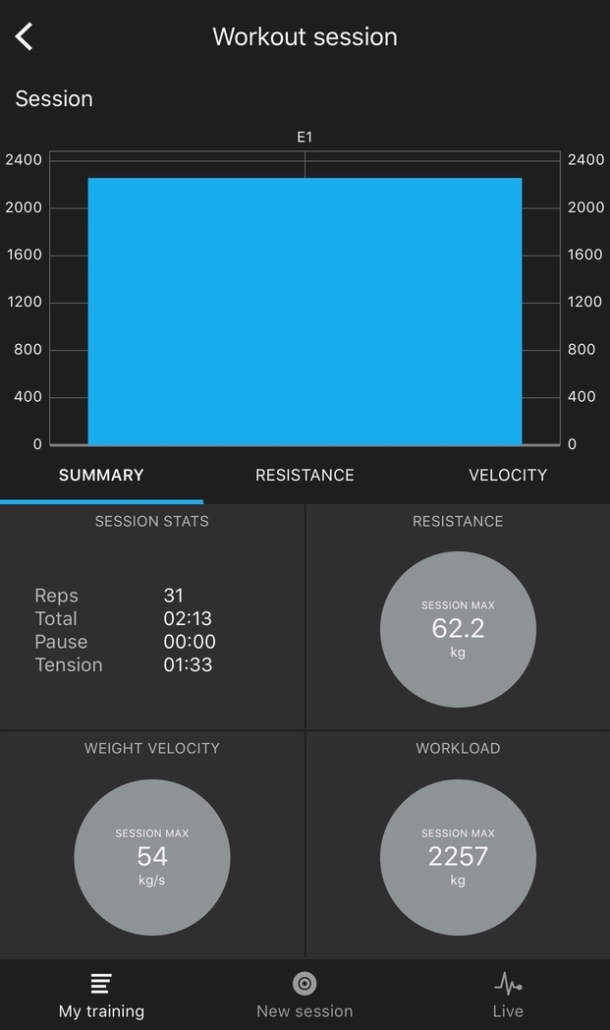
Drill-down, pinch and zoom in this area

2

3 detail tabs that contain more detailed information

3

The overall stats. Also drill-down aware.

4

The best values based on the scope of the drill-down. Session > Exercise > Set

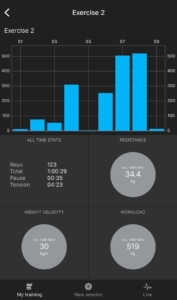
Workout session analytics works in a drill-down fashion. First you will see the overall summary of the session.

The three tabs will show respective info with the session as a scope. In the resistance and velocity tab you will additionally see some links to the best exercise and set with the highest values in this session.

The graph on top can be used to drill into the exercises, sets and reps. Just tap on the exercise column you would like to access and it will drill-down and show you the metrics of the specific exercise. Tap on a graph bar again (scope is now a set within the exercise) and you can access the repetition representation of that set.

In the repetition representation you are able to tap anywhere in the graph to see the resistance info as well as pinch to zoom in and out.

EXERCISE ANALYTICS

1
2
3
4
1

List of all tagged exercises

2

Tap to get into exercise analytics view

3

Hide exercises to declutter the list in a workout session

4

Swipe left to hide/unhide or rename an exercise

Exercise analytics works just like session analytics (please refer to session analytics above).

What is different is that you will see all occurrences of this exercise in the graph. One bar in the graph represents an exercise and the height of the bar represents the total workload of the exercise.

A tap on the bar will guide you to that exercise and show all relevant metrics in the lower portion of the screen. You can also pinch and zoom if you have many exercises in one graph.

1
2
1

Each column is one exercise

2

Details based on the current scope

DEVICE SETTINGS

1
2
3
4
1

Scan QR-code to connect to the corresponding powrlink

2

Unique sensor name

3

Lets you generate the unique QR-code for that sensor

4

Connect to the sensor manually

In the device settings screen you can manage all your powrlink devices. You can connect to powrlink products using either a QR-code or by clicking connect in the list of sensors on the lower portion of the view. In the list of sensors, you will also see the currently selected sensor.

You are able to calibrate the active sensor by tapping calibrate. Calibration enables you to factor in any equipment that is suspended from the sensor or any other base load of any equipment that should not be counted towards your training load.

For all sensors in the list you are able to generate their respective unique qr-codes by tapping qr-code next the sensors name (internet connection needed). It will generate qr-code that you can save as an image or print as needed. Any powrlink app user will be able to connect to that sensor just by pointing the camera section on that qr-code.

MY ACCOUNT – USER PROFILE

1
2
3
4
1

How much time do you need to get ready for a new exercise?

2

Used to filter out small movements. Adjust as needed.

3

x2 allows you to install the powrlink Sensor on one side of a bilateral exercise

4

This will swap out the lower left gauge in live view to show acceleration data

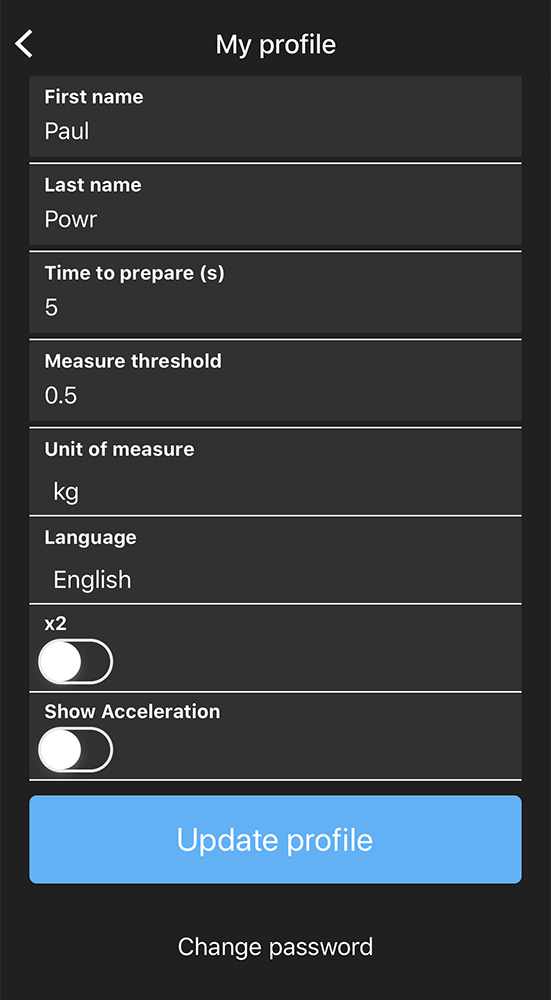
In your profile you can add your basic user data name and password.

You can also edit the settings for the get ready count-down timer (how many seconds do you need between sets?) and the measurement threshold.

The measurement threshold is a convenience feature that will prevent the software from recording minor movements as a resistance. The default threshold is 1kg/lb. If you need a lower or higher threshold you can define it here.